Request Count Dashboard
The Request Count Dashboard page allows you to view the number of requests that were processed through the Kourier REST Gateway within the time period you specify in the Select Date Range drop-down menu. The following image shows an example of the Request Count Dashboard page.
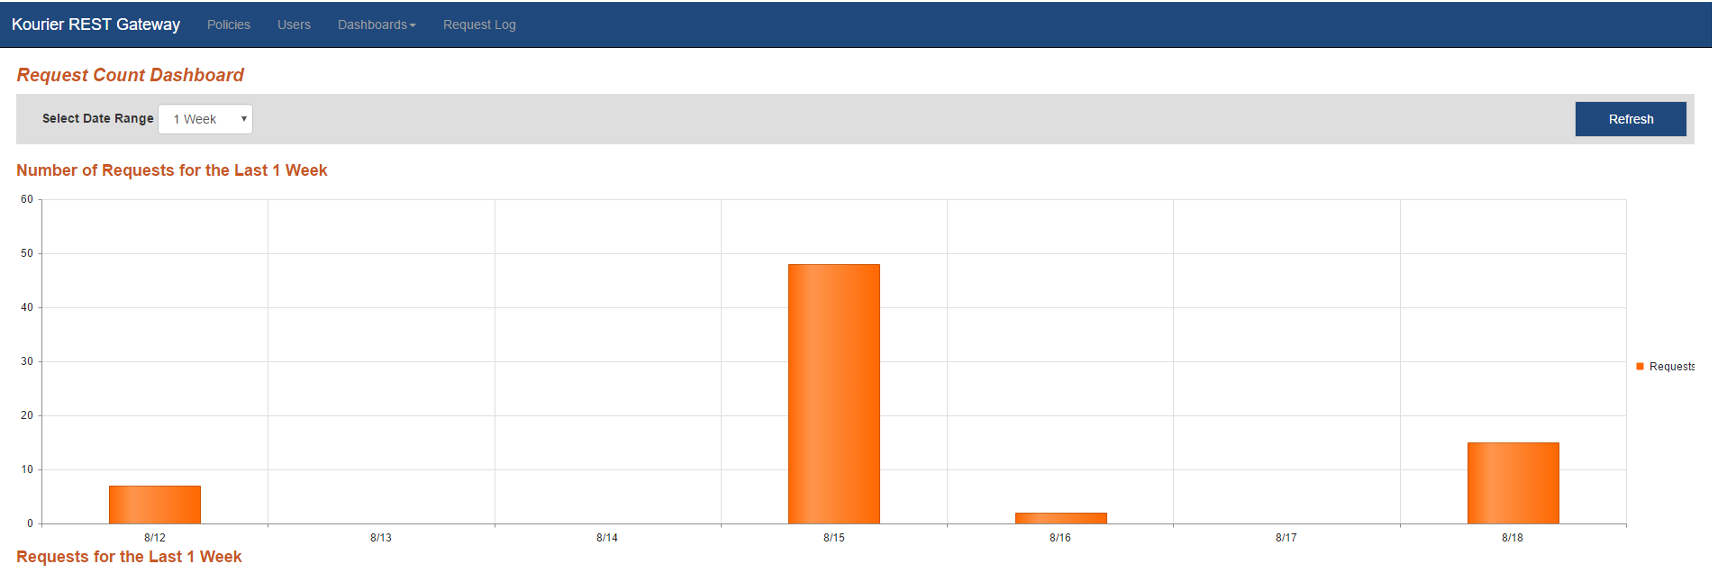
The Request Count Dashboard page contains the following elements.
|
Field Name |
Description - Usage - Notes |
|---|---|
|
Select Date Range |
The Select Date Range drop-down menu allows you to select a time range for which you want to view request count data. |
|
Refresh |
Click the Refresh button to update the request count data. |
|
Export to Excel |
Click to export the data to a Microsoft Excel spreadsheet. |
|
Id |
The Id column |